SignalLab
See what your
signals are doing.
A Windows workspace for industrial trending, recording, and diagnostics. Explore an offline demo or configure read-only Siemens S7 acquisition.
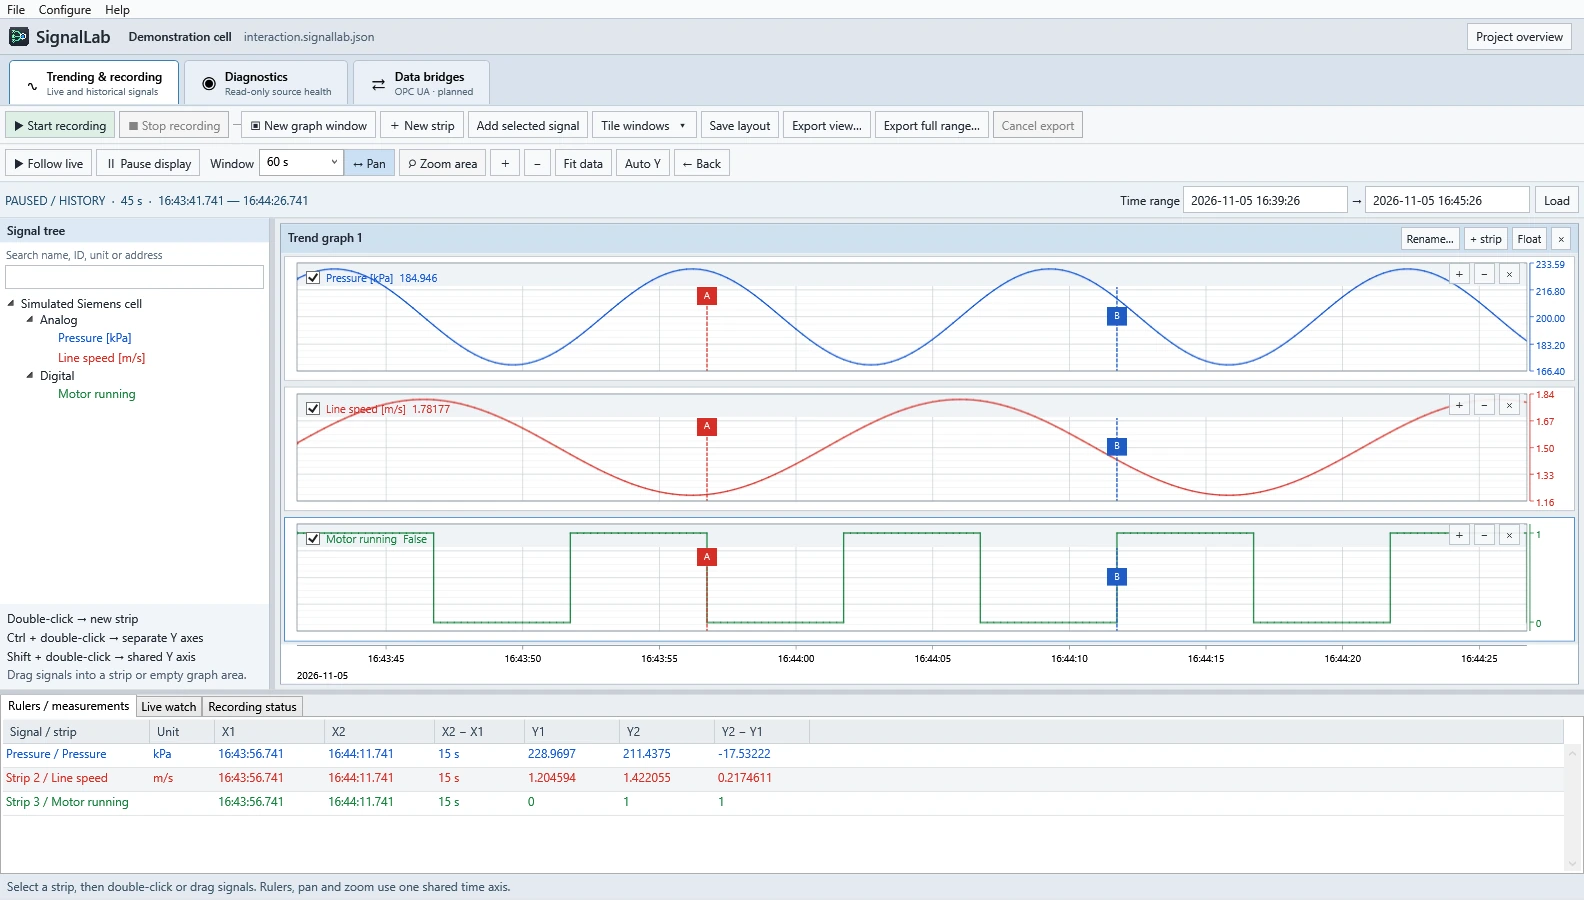
Compare signals in different layouts
Pressure (kPa), line speed (m/s), Motor running, and Ready come from the built-in simulator. Stack traces on a common time axis to compare their timing. Tile graph windows to keep an overlay and individual traces open together.
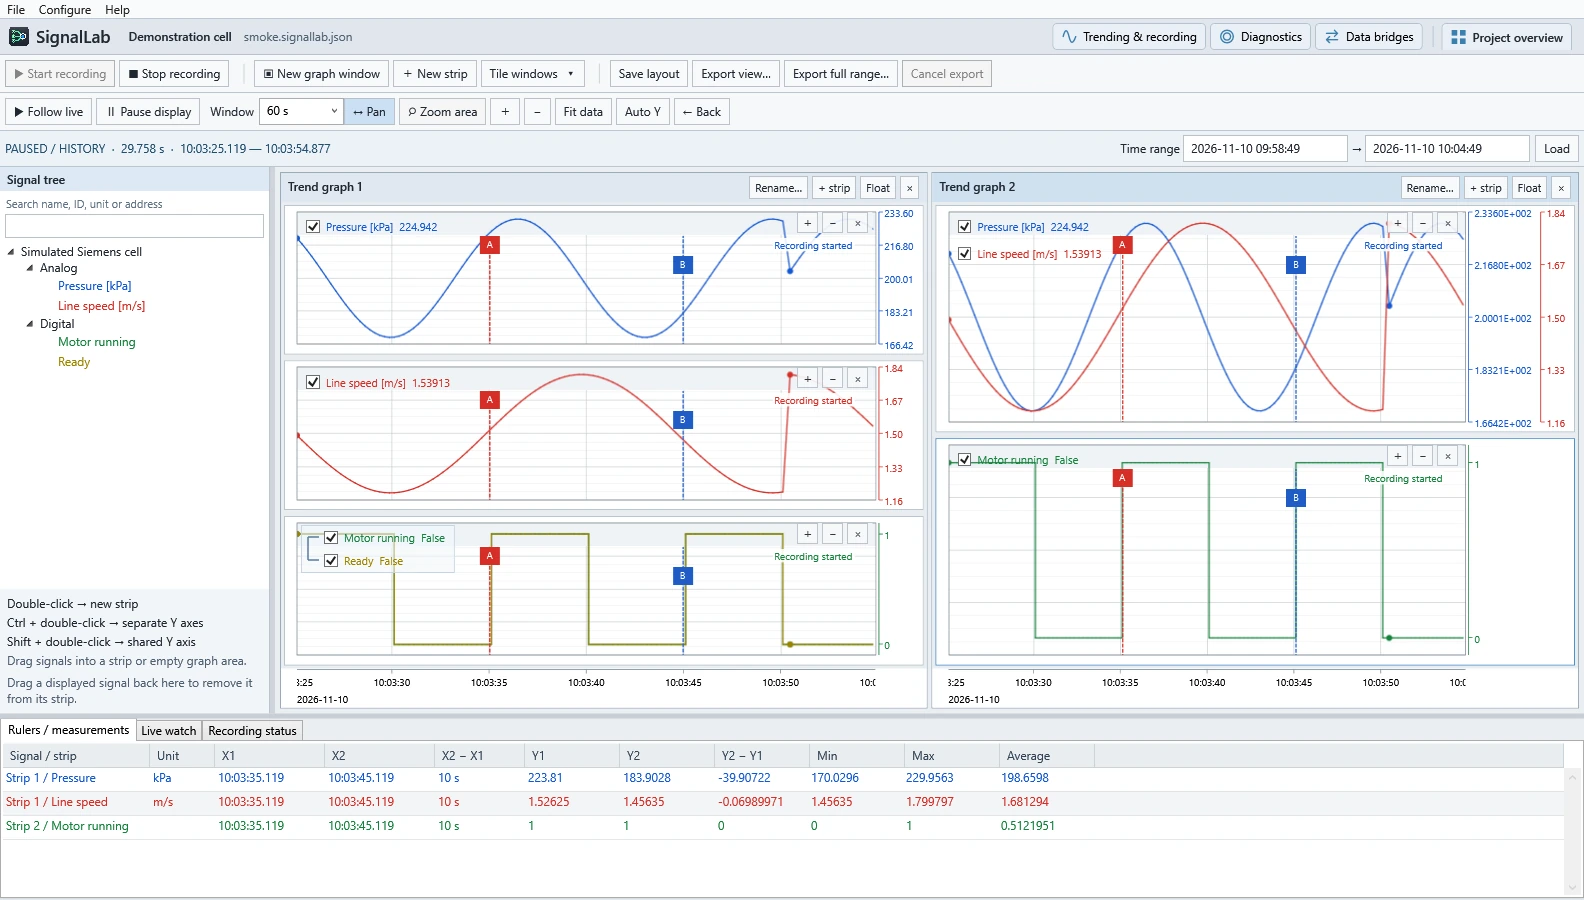
Investigate a saved recording
Pause the display to measure an event while acquisition continues. Open saved captures side by side on their original time axis, inspect gaps and sample quality, and use rulers to compare two points in time.
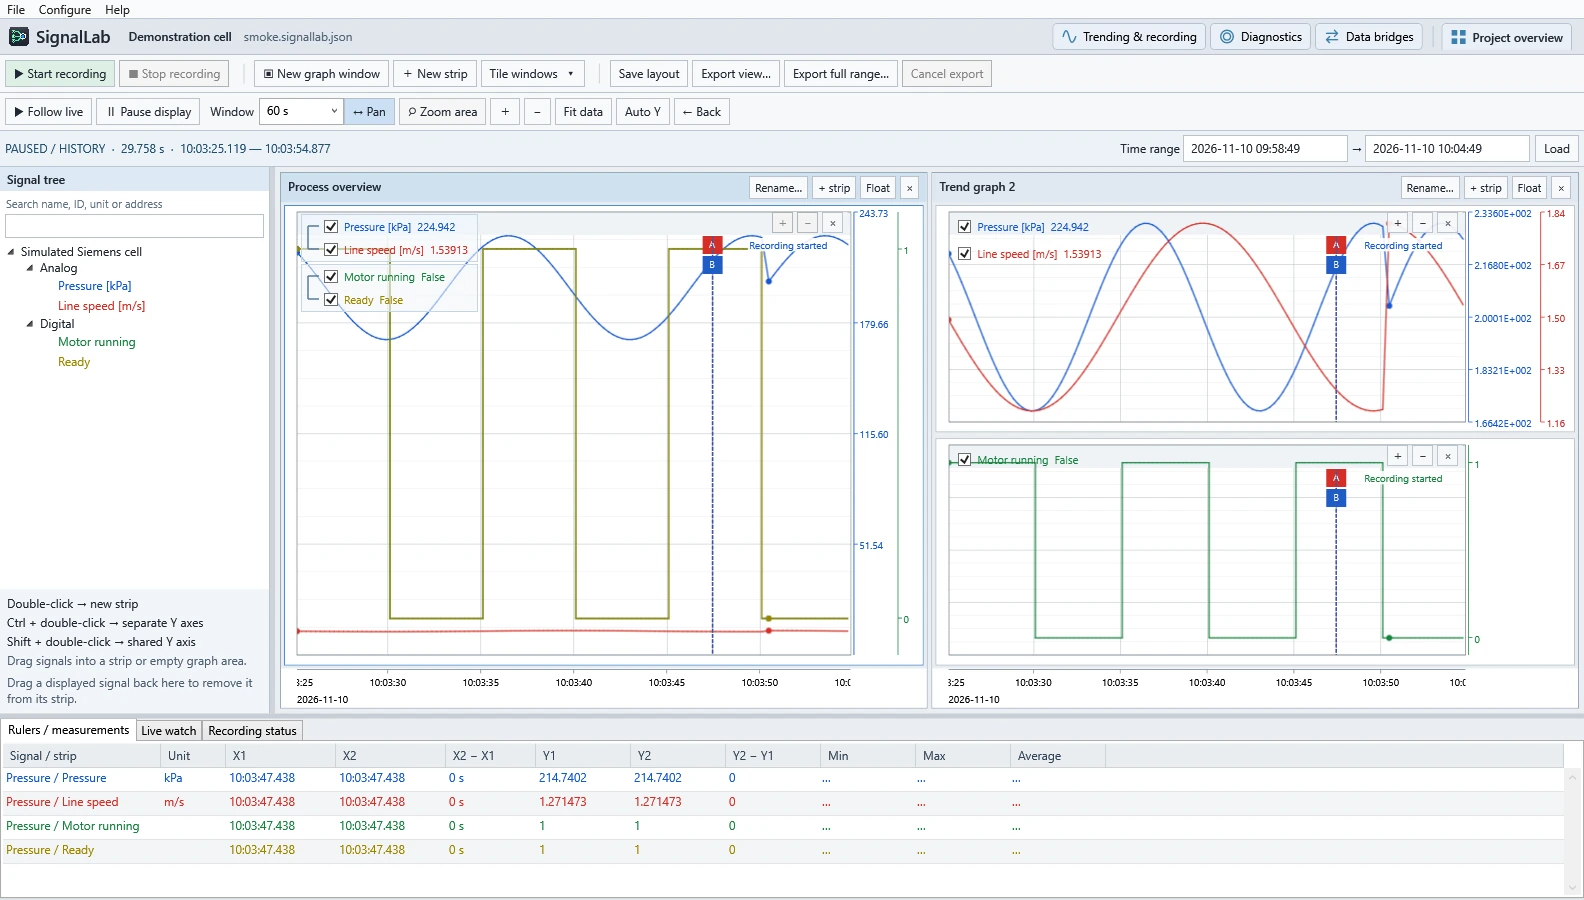
Export the displayed view, or export the raw samples for the full selected interval to Excel or CSV.
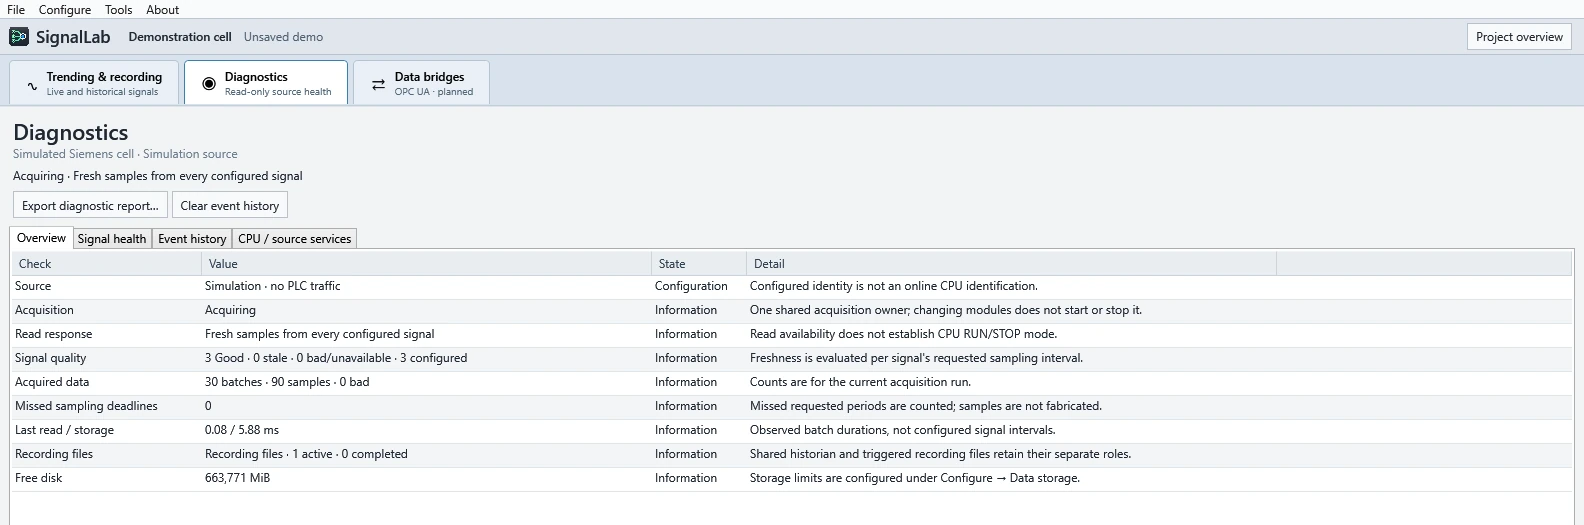
See what the recorder is receiving
Check source connection state, signal freshness, quality, and recording status. The preview supports multiple configured S7 sources with separate polling and reconnects. Physical PLC qualification is still in progress.